Best Horse Racing Betting Sites – Bet on Horse Racing in 2026
Loading...
In Flat racing, the draw can be worth lengths before a horse takes a stride. At certain tracks, being on the wrong side of the stalls is practically a death sentence. And when a non-runner comes out of the field, the draw picture changes — sometimes subtly, sometimes drastically. The draw is set at declaration — but non-runners redraw the advantage.
Understanding how withdrawals interact with draw bias is one of the more nuanced elements of race analysis. It requires knowing which tracks favour which stall positions, why those biases exist, and how the removal of a runner alters the physical dynamics of where the remaining horses line up. Most punters treat the draw as a static fact. In reality, it’s a variable that shifts every time the field changes.
Draw Bias in UK Racing: A Quick Primer
Draw bias exists because racecourses are not symmetrical. A track with a tight left-hand bend shortly after the start favours horses drawn low (near the inside rail), because they have less ground to cover to reach the bend. A straight course with a prevailing camber may favour one side over the other, depending on the ground. A course where the watering system doesn’t reach the far rail may produce faster ground on one side, giving an advantage to horses drawn there.
The strength of draw bias varies by track, distance, field size, and going. In large-field sprints at courses like Chester, Beverley, and Goodwood, the draw can be decisive. In small-field races over longer distances, it matters less because the field has time to settle into position before the pace demands kick in. With average Flat field sizes at 8.90 runners per race in 2025, according to the BHA’s 2025 Racing Report, most races sit in a middle ground where draw matters but doesn’t dominate — except at the tracks with the most pronounced biases.
The data behind draw bias is extensive. Racing data services publish stall statistics by track, distance, and going, showing win and place percentages for each stall number over thousands of races. These statistics form the basis of most draw analysis, and they work well as long as the declared field matches the field that actually runs. When a non-runner changes the field composition, the statistics need reinterpretation.
How a Non-Runner Alters the Draw Picture
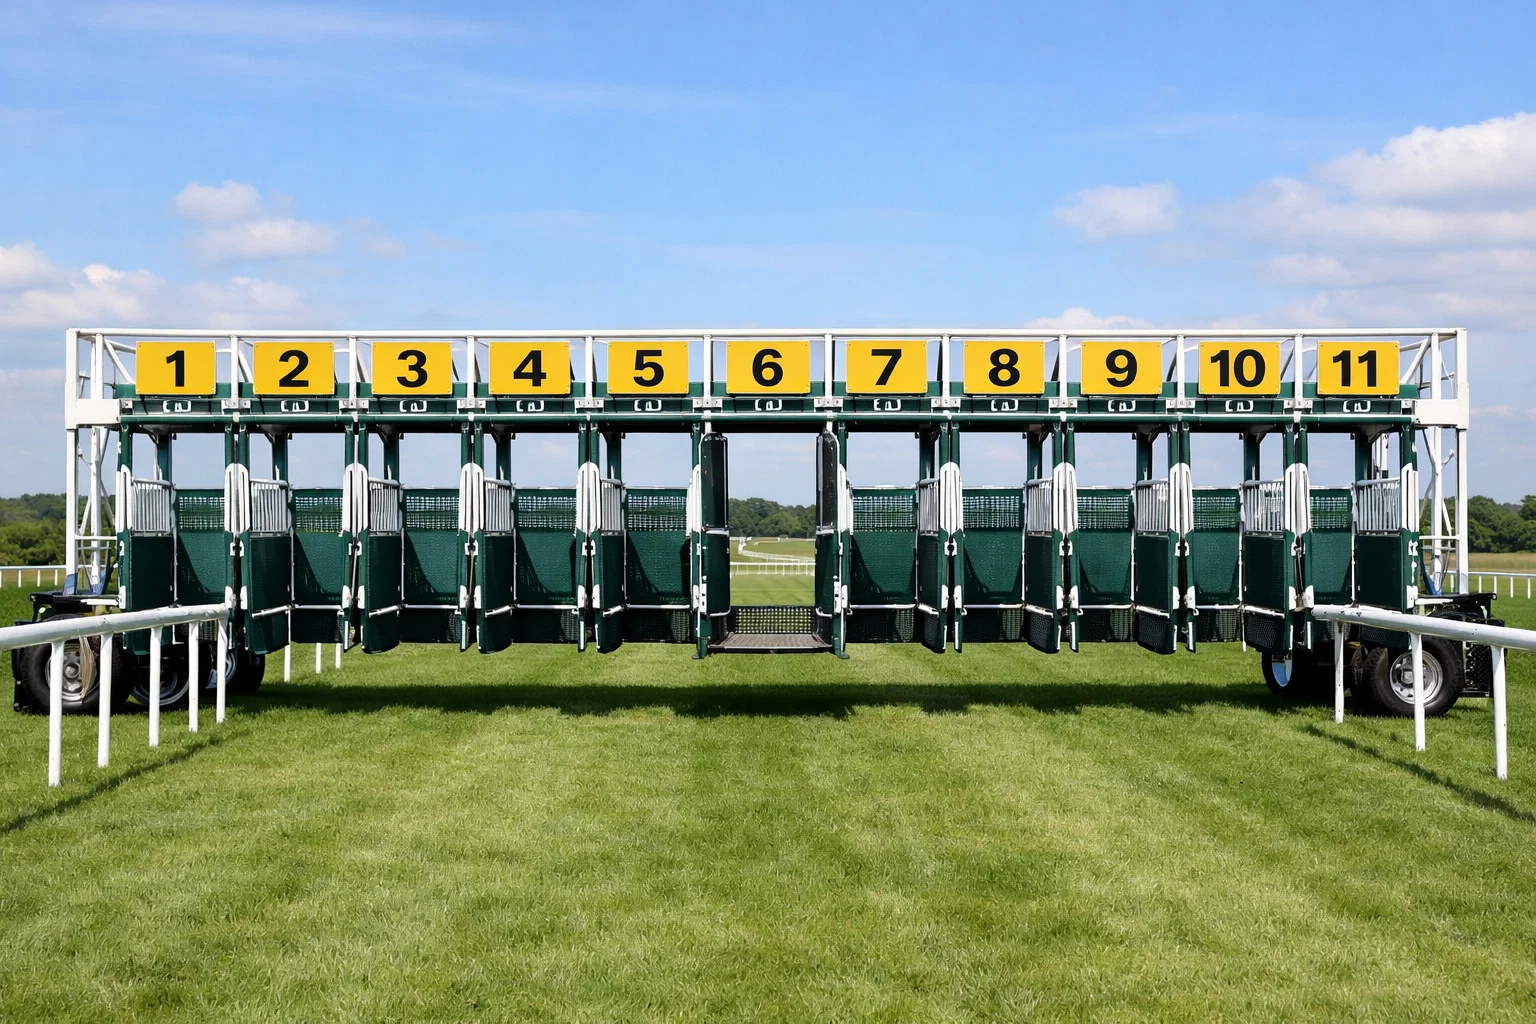
The first thing to understand is mechanical: when a horse is withdrawn, its stall is left empty. The remaining horses do not physically move to different stalls. If horse 3 is a non-runner, stalls 1, 2, 4, 5, and so on are still occupied by the same horses. There’s simply a gap where stall 3 was.
But the practical effect of that gap depends on where it falls. If the non-runner was drawn on the rail (stall 1 on a left-handed track), the horse in stall 2 is now effectively the inside horse — it has the rail position without the traffic that a full field would create on its inner. That horse gains an advantage it didn’t have when the field was declared. Conversely, if the non-runner was drawn wide, the horses on the outside lose a piece of cover — there’s one fewer horse between them and open space, which may not matter on a straight course but can be significant on a turning track.
The second effect is on field dynamics. Draw bias data is calibrated to specific field sizes. The statistics showing that stall 1 at Chester over five furlongs has a 22% win rate might be based on races with 10-12 runners. If two non-runners reduce the field to 8, the bias pattern may not hold in the same way, because smaller fields allow more room to manoeuvre and reduce the congestion that creates the bias in the first place.
A non-runner from the middle of the draw typically has the least impact. The horses on either side simply have slightly more space, but the overall shape of the field — inside pack, outside pack, rail runners, wide runners — remains broadly the same. A non-runner from the extremes (stall 1 or the widest stall) has the most impact, because it changes the relationship between the field and the rail.
The draw is set at declaration — but non-runners redraw the advantage. The punter who recognised a strong low-draw bias and backed the horse in stall 2 may find that their edge has evaporated if the horse in stall 1 is withdrawn, because now stall 2 is effectively the rail position and the original statistical basis for the bet has shifted.
Track-Specific Examples: Chester, Beverley, Goodwood
Chester is the most draw-dependent track in Britain. The tight left-hand circuit, with its sharp bends and short straight, produces extreme low-draw bias in sprint and mile races. Horses drawn in stalls 1-3 have a significant statistical advantage. When a low-drawn horse is withdrawn, the next horse toward the rail inherits some of that advantage — but the gap in the stall line can also create a pocket of space that allows a slightly wider-drawn horse to angle across to the rail earlier than they otherwise could.
Beverley’s draw bias runs in the opposite direction for certain distances. The undulating track and its sharp right-hand turns create scenarios where high draws (near the stands rail) have an edge, particularly over five furlongs. A non-runner from a high stall on Beverley affects the dynamics differently from the same scenario at Chester: the wide horses lose a piece of their group, while the inside horses gain nothing because the bias already works against them.
Goodwood offers a different pattern again. The track’s unique topography — the steep hill, the camber, and the long straight course that actually curves — creates draw biases that change significantly with the going. On fast ground, high draws on the straight course tend to do well. On softer ground, the advantage can flip. A non-runner at Goodwood interacts with both the draw and the going, making it a track where post-withdrawal reassessment is particularly valuable.
Premier fixtures at these tracks tend to produce larger fields, which amplifies draw bias. On Premier Flat days in 2025, average field sizes were 11.02 — well above the Core figure of 8.65. As BHA Director of Operations Richard Wayman noted, the strategy has been to make the best racing better and use that to grow interest in the sport. Larger fields at Premier meetings mean draw bias is at its strongest — and non-runners at those meetings carry the most significant draw implications.
Redraw the Map After Every Withdrawal
Draw analysis doesn’t stop at the declaration stage. Every non-runner changes the equation — sometimes marginally, sometimes meaningfully. At draw-dependent tracks, a single withdrawal from the rail or the widest stall can shift the advantage from one group of horses to another. Build the habit of rechecking your draw assessment after non-runners are announced. The draw is set at declaration — but non-runners redraw the advantage, and the punter who updates their analysis fastest has the best chance of finding value in the adjusted market.